If you’re a marketer, the most fundamental responsibility you have is to move the proverbial needle–sell a widget, book a hotel room or change your customer’s behavior in some way, shape or form. If you’re an ad agency like us, moving the needle equates to accountability as stewards of your client’s brands and the investments you manage.
To make smart decisions and pivot as needed, you must have information that is accurate, timely and available. As numbers people, we at Morgan & Co. use data constantly to monitor how a media strategy is performing. For us, building a solid dashboard system that arms us with the data we need to exceed our clients’ expectations is a labor of love. So how do we do it?
Based on 22 years of managing media campaigns, here are our thoughts on how to build a system that provides quick, clear access to information and data on how a marketing or advertising campaign is performing.
Get access to the data
Arguably the most challenging part of building a dashboard is accessing the data. Too often, the information that exists is out of reach. Sometimes the keys to the data are held by a department other than the marketing team. You will need to get these key holders on board by figuring out how to get buy-in so they feel involved. More involvement equates to a better outcome (read: they’ll be more likely to share).
What systems house the data?
Once the data can be accessed, you will need to figure out what systems the data is housed in and how its collected. The dashboards listed at the bottom of this article all have their pros and cons in terms of which integrate with popular client-based systems. Do some homework on the integration ability of the system collecting and housing the data BEFORE you choose a dashboard tool. Nothing is worse than investing in a dashboard, getting trained, then realizing it will not communicate with your internal systems.
How often will data be pulled?
If the dashboard will be used for optimization and real-time adjustments, then the data from the client’s system must be imported constantly. Yes, there might be some lag time, but look for a system that pulls in data as often as possible. On the other hand, if the dashboard is primarily used to review progress towards goals, strategic observations and opportunities, pulling in data less frequently, like monthly or quarterly, might be acceptable. Some dashboards do not talk with a client’s internal data system naturally. So, an API (application programming interface) will have to be created to bridge the two.
The other option is to export data out of the client’s system into a Google Sheets and format accordingly. Most of the dashboards below will integrate and pull information from Sheets. However, this is more of a manual process that requires someone devoted to the task.
Crawl, Walk, Run
If this is your first foray into dashboards, the best advice I can give you is to start small. Pick the most important pieces that you want to measure and report via your dashboard and little else. Establish simple goals with the idea of attaining success. Once you have success with the system and win support, you can grow the system and get more complicated.
Why start small? Truth be told, its easy to over-complicate a dashboard. Agency people, clients, etc. all want something to be measured and reported. The more complicated, the harder to manage within a dashboard. And frankly, if you’re monitoring everything, then nothing is really important. It all becomes equal.
Take our hotel clients, for example. The very top line in our dashboard shows only three things: the media spend, # of rooms booked, and the cost of booking a room (or CPA). That’s it. We have a goal of number of rooms, at a specific CPA, and that’s all that matters. So those three items are the most prominent on a very simple dashboard. Remember, marketing attribution, reporting and dashboards are a system or culture that you’re trying to create. So,move slowly, win support and grow from there.
Popular dashboard systems
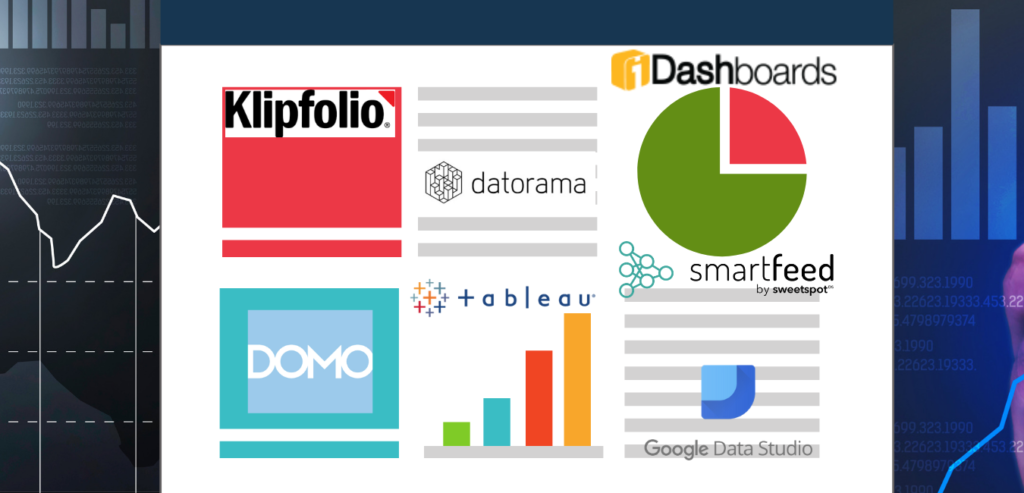
If you’re not sure where to start, don’t worry, there are a ton of dashboards. Well, maybe that’s the problem. There are too many dashboards. With that being said, below is a list of the more popular dashboard systems we’ve come across in the last few years. While we do not endorse any (our lawyers made us say that), we can say we’ve used half of them in one form or another and are currently using one and love it.
Email us and we’ll tell you our thoughts on them all!
Smartfeed
Collect, normalize and visualize all your digital data in one place.
Datorama
Recently acquired by Salesforce, Datorama is a cloud-based, AI-powered marketing intelligence and analytics platform for enterprises, agencies and publishers.
Dashthis
Dashthis is an online marketing reporting dashboard created for agencies and digital marketers.
Tableau
Tableau can help anyone see and understand their data. Connect to almost any database, drag and drop to create visualizations, and share with a click.
Klipfolio
Klipfolio is an online dashboard platform for building powerful real-time business dashboards for your team or your clients.
iDashboards
iDashboards is a data visualization solution that can transform your data reporting into interactive business intelligence dashboards.
Domo
Domo is the operating system that allows you to run your entire business on your phone.
Google Data Studio
Data Studio turns your data into informative reports and dashboards that are easy to read, easy to share, and fully customizable. Free to sign up.


